Format Chart Axis Position
You can add a second y-axis, or change the position of the y-axis on a chart. For horizontal charts, you can add a second x-axis or change the position of the x-axis instead.
Formatting the chart axis is available for the following visualisation types:
Change the position of the chart axis
After adding at least one column to the y-axis (for vertical charts) or the x-axis (for horizontal charts), you can change the position of the axis.
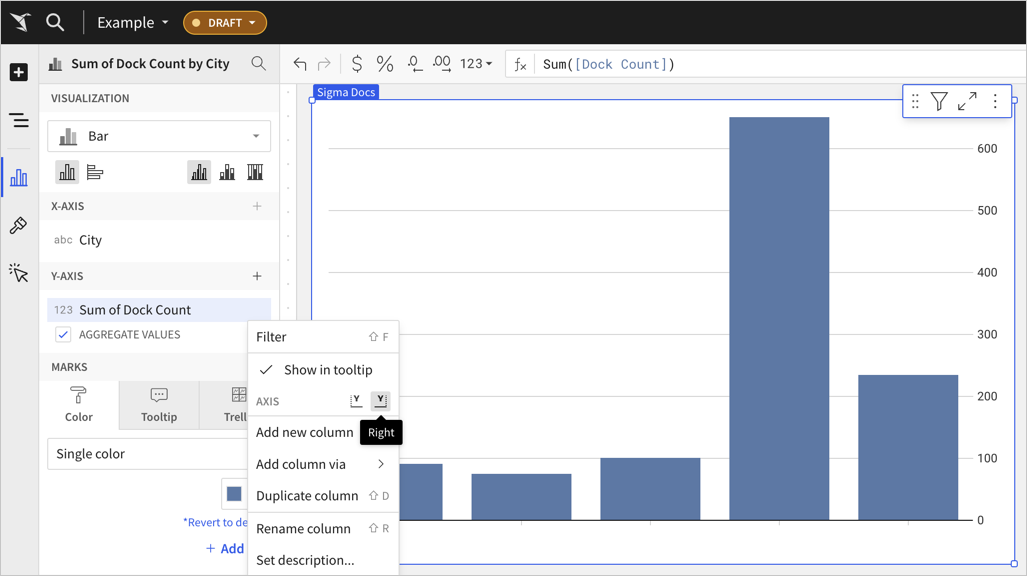
In the editor panel, hover over the y-axis column name, then click the caret (
) to open the column menu.
For Axis, select the image that shows the axis in the position that you want.

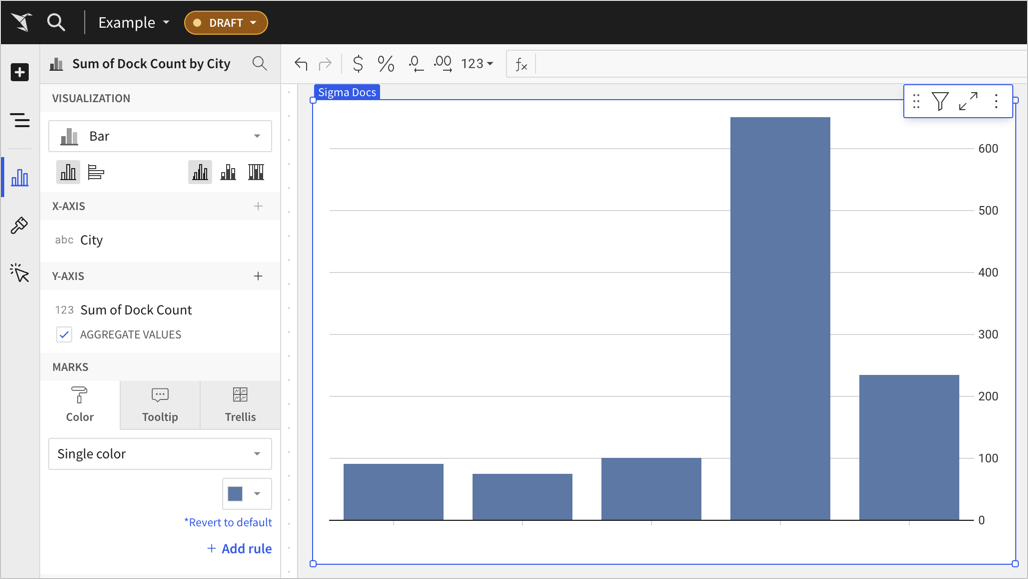
The chart updates with the axis in the new position.

Add a second chart axis
For charts that visualise at least two columns on the y-axis (for vertical charts) or the x-axis (for horizontal charts), you can add a second chart axis.
Before you start: This action uses the editor panel. If you have not done so already, open the editor panel from either Explore or Edit mode.
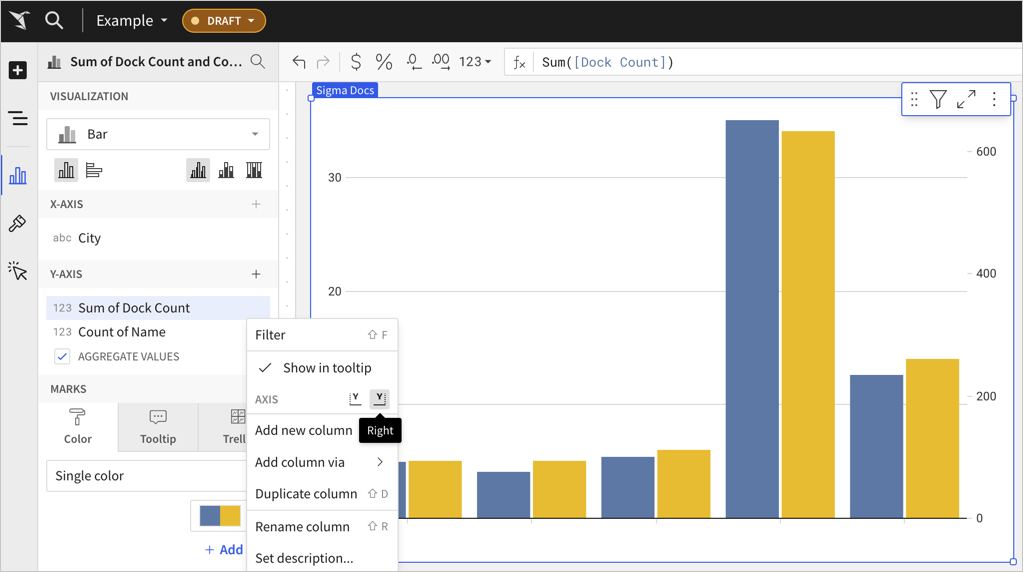
In the editor panel, hover over the y-axis column name, then click the caret (
) to open the column menu.
For Axis, select the image that shows the axis in the position that you want.

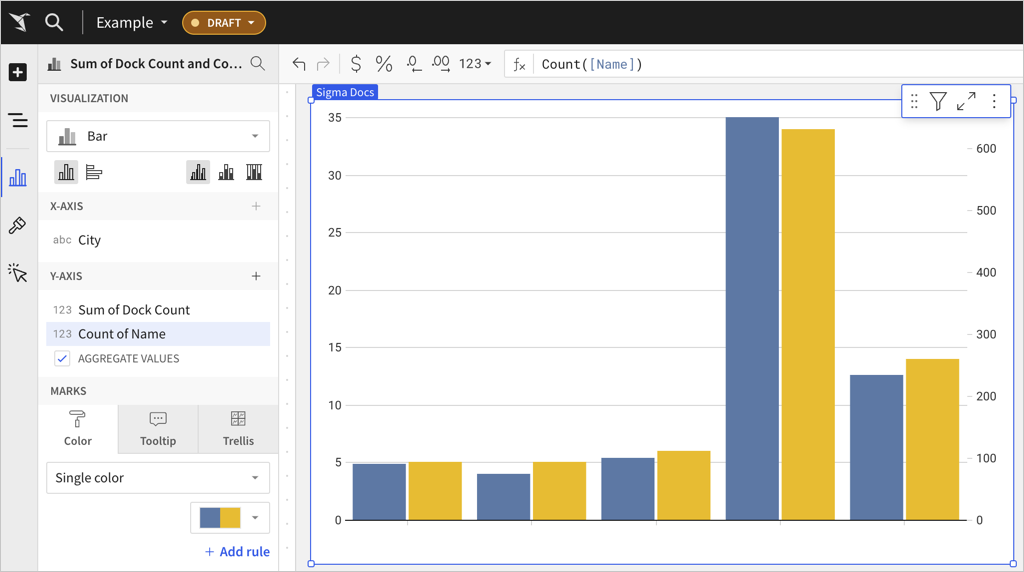
The chart updates to show a second y-axis.

Last updated
Was this helpful?